Introduction
In my previous post, I explored the RStudio interface and ran a few simple commands. In this post, I started learning how R stores and works with data. Understanding objects, vectors, and data frames helped me see how R organizes information before doing more advanced analysis.
Creating Simple Objects
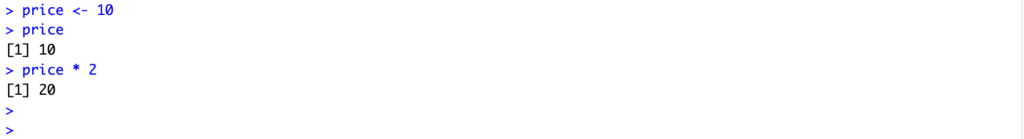
One of the first things I learned is that R stores information in something called objects. An object is basically a name that holds a value. For example, I can create an object like this:
price <- 10
price
price * 2
Here, the number 10 is stored in an object called price. After that, I can reuse it in other calculations. This makes it easy to keep track of numbers instead of typing them repeatedly.
Storing Multiple Values
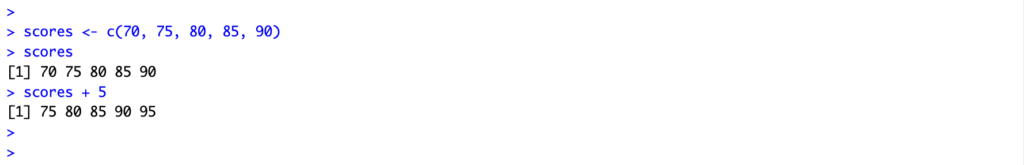
R can also store several numbers together. This is called a vector. A vector can be created using the c( ) function.
scores <- c(70, 75, 80, 85, 90)
scores
Now the object scores contain five numbers. R can also perform calculations on the entire vector at once.
scores + 5
This adds 5 to every number in the vector. I found this interesting because R can process many values at the same time.
Creating a Small Dataset
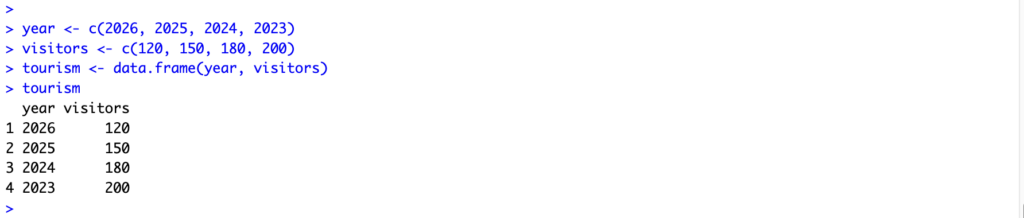
Another useful structure in R is something called a data frame. A data frame is similar to a small table. For example:
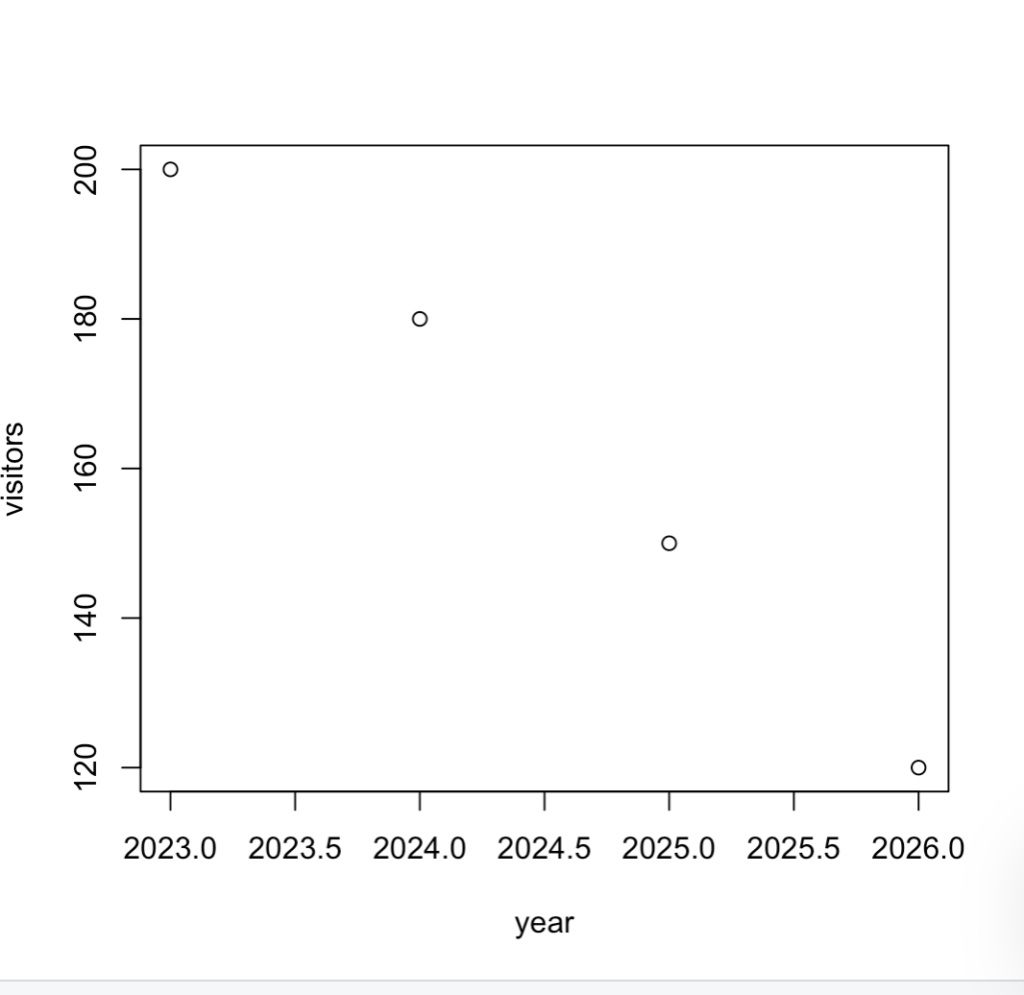
year <- c(2026, 2025, 2024, 2023)
visitors <- c(120, 150, 180, 200)
tourism <- data.frame(year, visitors)
tourism
This creates a small dataset with two variables: year and visitors. The rows represent different years, and the columns represent different types of information.
Looking at the Data
R also allows us to quickly summarize data. For example, we can calculate the average value.
mean(visitors)

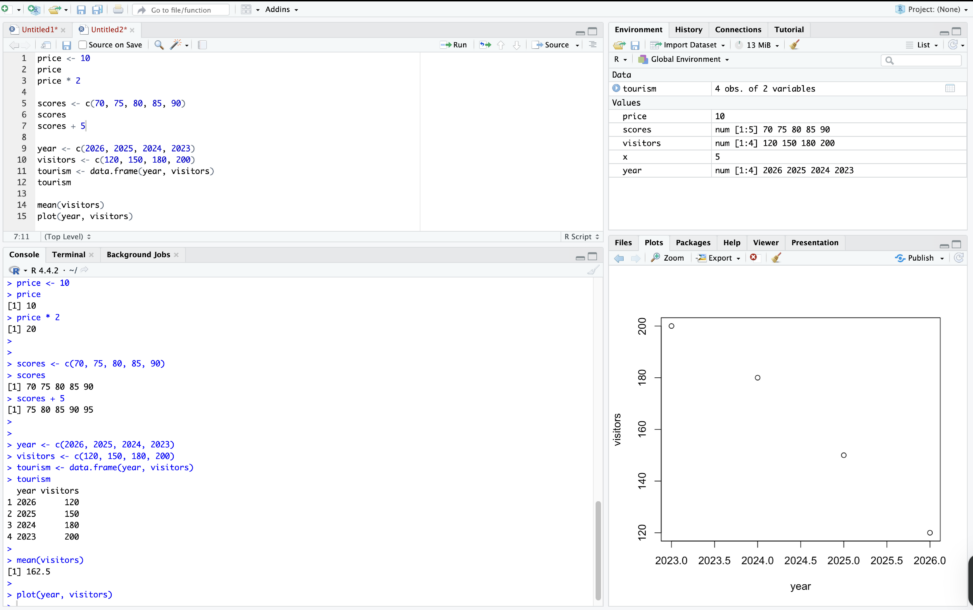
We can also create a simple graph.
plot(year, visitors)
This helps us see how the number of visitors changes over time.
In this post, I practiced creating objects, storing multiple values, and building a small dataset in R. These basic steps helped me understand how data is organized in R. In the next post, I will try importing a real dataset and exploring it further.