
In my previous blog posts, I learned some basic R skills and worked with simple examples. In this post, I started using real-world data.
For my topic, I chose three variables: life expectancy, GDP per capita, and public health expenditure. I found these datasets online from Our World in Data.
I chose these datasets because they are easy to understand and related to my topic. In this post, I will show how I imported the data into RStudio and prepared it for analysis.
Importing the Data
After downloading the datasets, I saved them on my desktop. Then I opened RStudio and used the read.csv() function to import the files.
life <- read.csv(“~/Desktop/life-expectancy.csv”)
gdp <- read.csv(“~/Desktop/gdp-per-capita-worldbank.csv”)
health <- read.csv(“~/Desktop/public-health-expenditure-share-gdp.csv”)
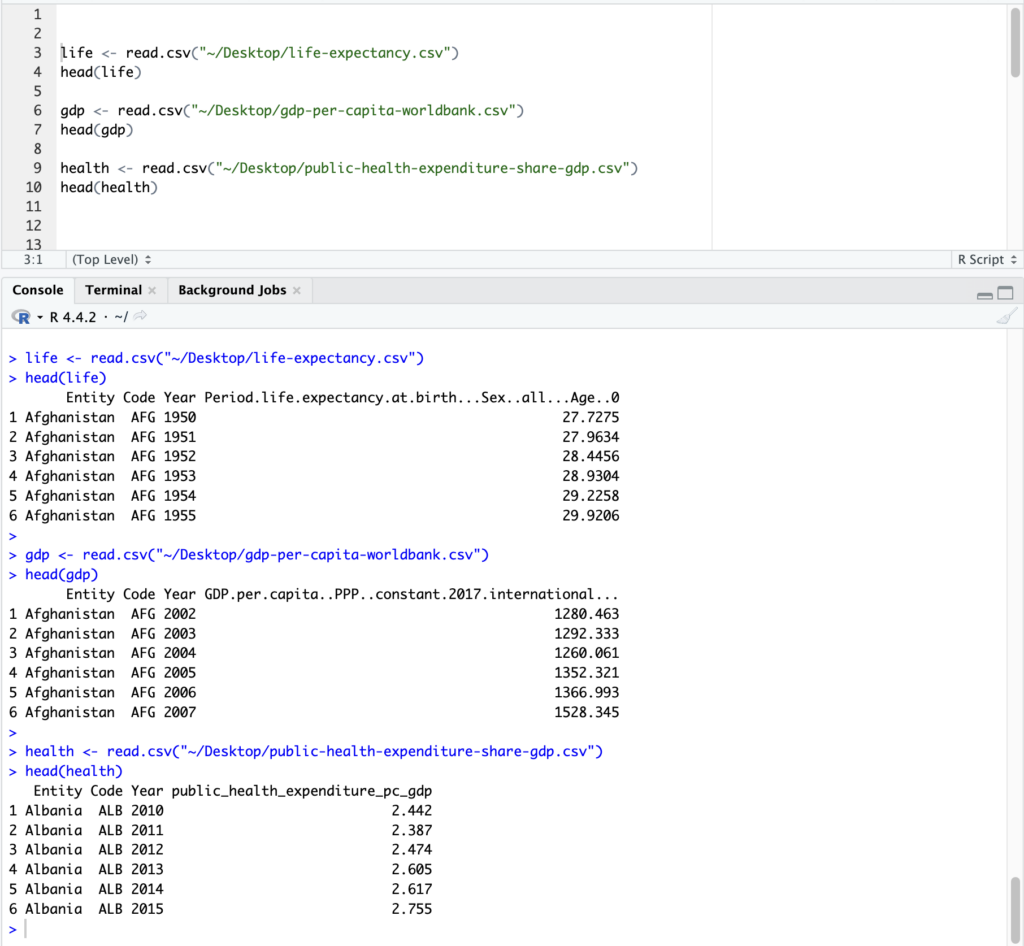
After importing the data, I checked the first few rows to make sure everything was loaded correctly.
head(life)
head(gdp)
head(health)
The screenshot below shows my data successfully imported into RStudio.
Merging the Data
After importing the datasets, I needed to combine them into one dataset. All three datasets share the same variables: Entity, Code, and Year, so I used these variables to merge them.
merged_data <- merge(life, health, by = c(“Entity”, “Code”, “Year”))
final_data <- merge(merged_data, gdp, by = c(“Entity”, “Code”, “Year”))
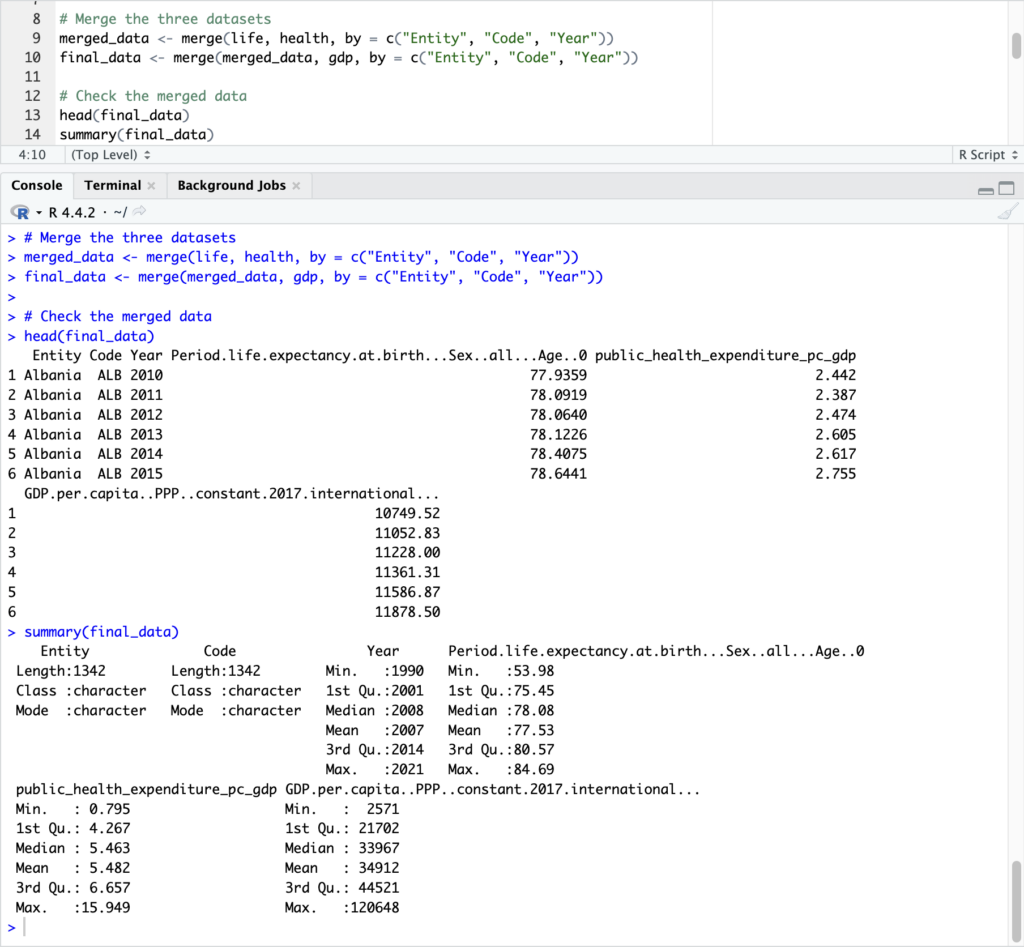
After merging, I checked the result again to make sure everything worked correctly.
head(final_data)
summary(final_data)
This step allowed me to create one dataset that includes life expectancy, GDP per capita, and health expenditure together, which I will use for further analysis.
The screenshot below shows how I combined the three datasets into one dataset and checked the results.
Conclusion
In this post, I imported and merged three real-world datasets in R. This step helped me move from simple practice to working with real data. In the next post, I will use this dataset to run a regression model and explore the relationship between the variables.