5 Month: March 2026
In my previous post, I imported and merged three real-world datasets in R. After preparing the data, I was ready to take the next step. In this post,…
This week helped me see digital literacy differently. The idea of Indigenous digital literacies showed me that technology does not mean the same thing for everyone. I learned…
In my previous blog posts, I learned some basic R skills and worked with simple examples. In this post, I started using real-world data. For my topic, I…

This week made me rethink who actually owns our data. Before, I saw tools like Google or email as just convenient for studying and daily life. However, now…
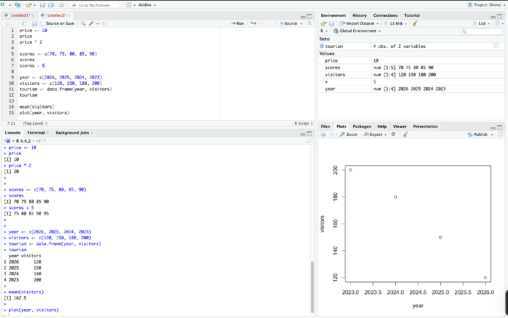
Introduction In my previous post, I explored the RStudio interface and ran a few simple commands. In this post, I started learning how R stores and works with…