
Introduction
For my inquiry project, I decided to learn how to use RStudio. As an economics student, statistical tools are often used in many courses, so I think this software will be useful for my studies. Through this project, I hope to understand the basic functions of RStudio and how it can be used for data analysis.
Installing R and RStudio
The first step was downloading R and RStudio from the official website.
Link:https://posit.co/download/rstudio-desktop/
After installing the software, I opened RStudio and started exploring its interface.
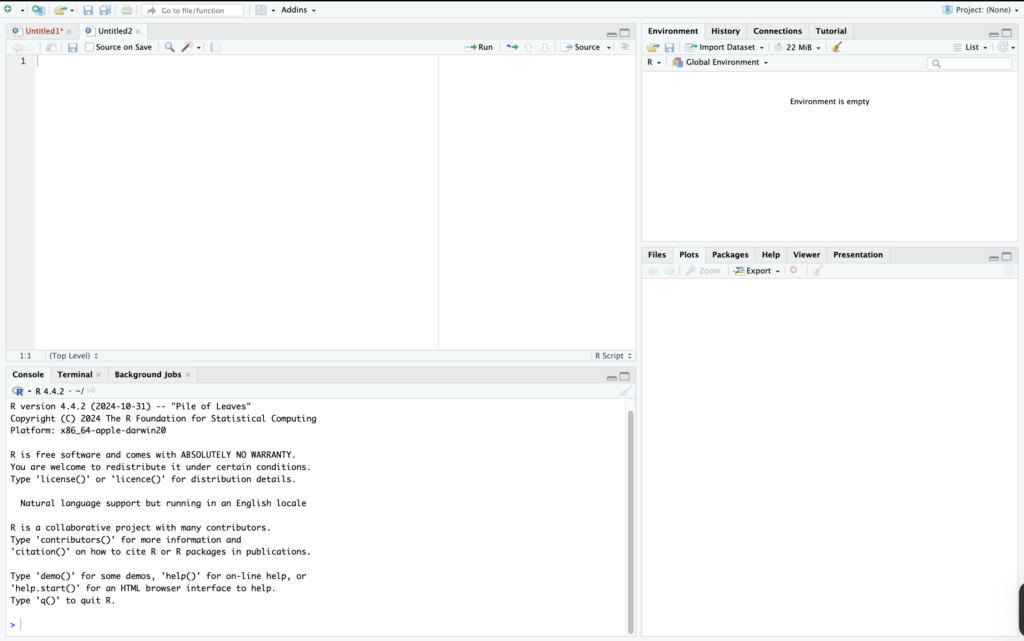
The script window is where users write and save code. The console runs the code and shows the results. On the right side, the Environment panel displays stored variables and datasets, while the Plots panel shows graphs and other outputs.
Understanding these panels helped me see how RStudio organizes the workflow for data analysis.
Trying My First Commands
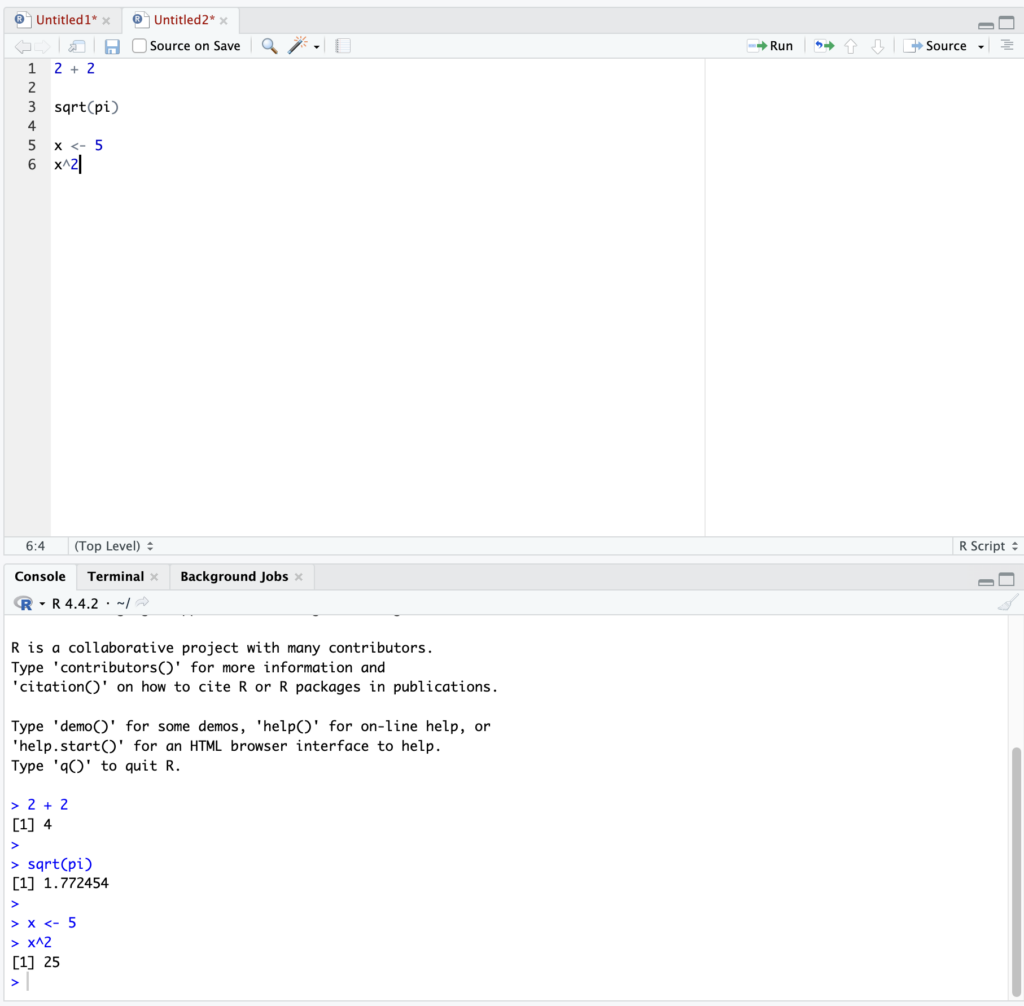
I started by testing a few simple commands in the console.
2 + 2
This returned the result 4, showing that the console works like a calculator.
I also tried another command:
sqrt(pi)
R quickly calculated the square root of π.
Next, I created a simple object:
x <- 5
x^2
This stored the value 5 in the variable x and calculated its square.
In short, this post introduced my first steps with RStudio, including installation, exploring the interface, and running a few simple commands.